|
If you know Madison, you know it is a great place to bicycle. This was fortunate for me as a very convincing person suggested I ride in RAW this past summer. To train for this 175-mile ride across the state, I rode around Madison. A lot. And, I used Strava to track my routes. So, now, I have quite a bit of information about where I’ve been cycling.
If you are a Strava premium member, they will make a map of the places you have ridden. I am not, but I am pretty good at parsing code together to do my bidding in R. Thanks in large part to Visual Cinnamon for posting code on visualizing running paths (http://www.visualcinnamon.com/2014/03/running-paths-in-amsterdam-step-2.html), I was able to make my own map of biking routes in Madison. The steps I used are below: Step 1. Get your GPX files from Strava. There’s a great article in Strava about how to export your data here. In short, you request your data from your profile and Strava will send you an email with a link to download all of the files (one file per route). Step 2. Import the GPX files to R. Importing spatial data into R can be tricky and, like Visual Cinnamon, I could not just use readGPX() to import my Strava GPX files. But, the code modification was minimal. Here is customization that ended up working to read in the Strava GPX files:
Step 3. Make a data frame with route index, latitude, and longitude.
Now that R has read the GPX files, you need to compile these files into a data frame with the spatial information. See http://www.visualcinnamon.com/2014/03/running-paths-in-amsterdam-step-2.html for the code. Step 4. Plot! There are many geographical mapping options in R, but I tend to use ggmap (created by David Kahle, https://github.com/dkahle/ggmap ). Here’s the final result: 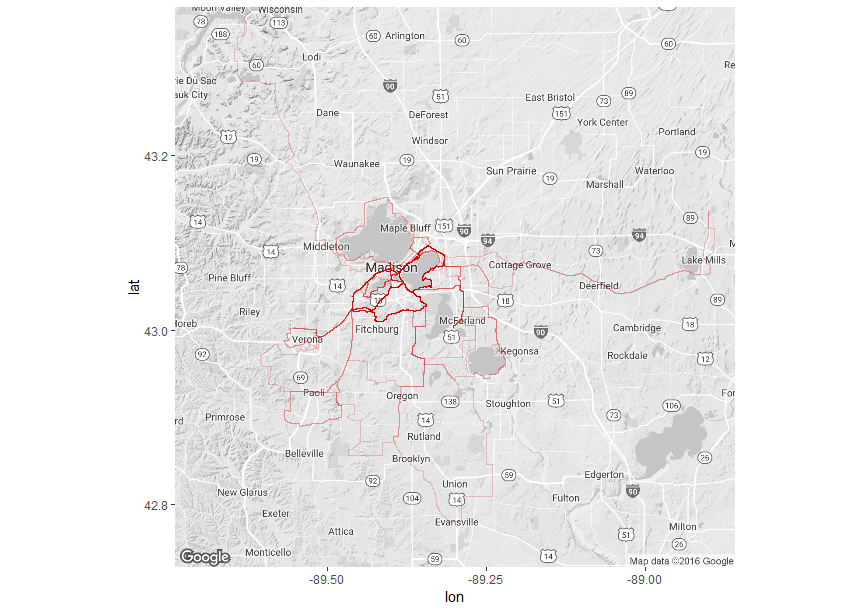
Figure 1. Heat map of bike routes I used in 2016 in and around Madison, WI, USA.
(An aside: If you are actually training for RAW, don’t just ride around Madison. Get thee out to the Driftless. You will thank yourself when you’re leaving Dubuque on ride day). And here is the complete code:
0 Comments
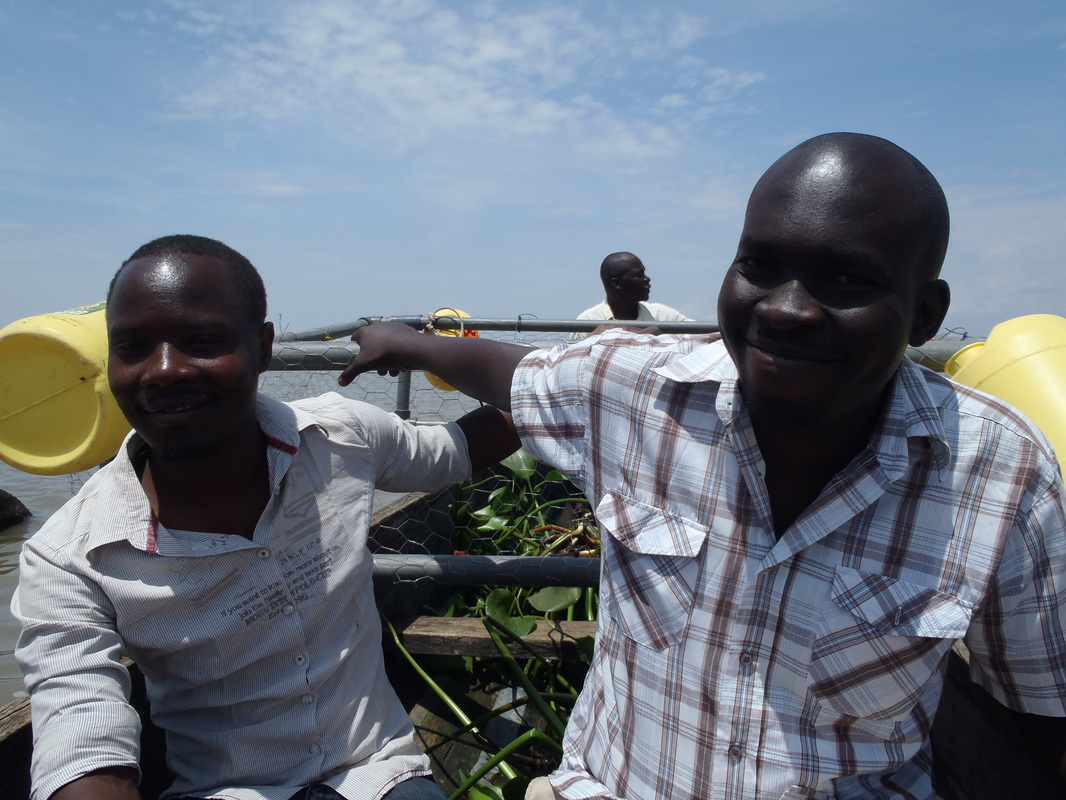
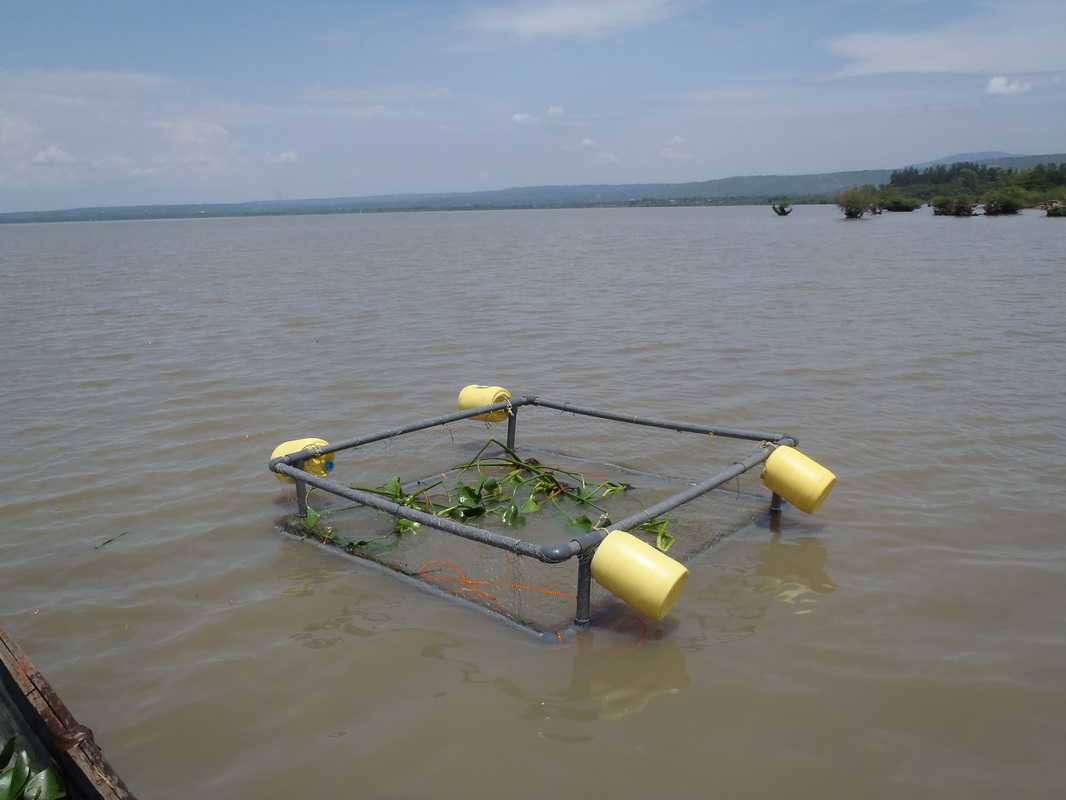
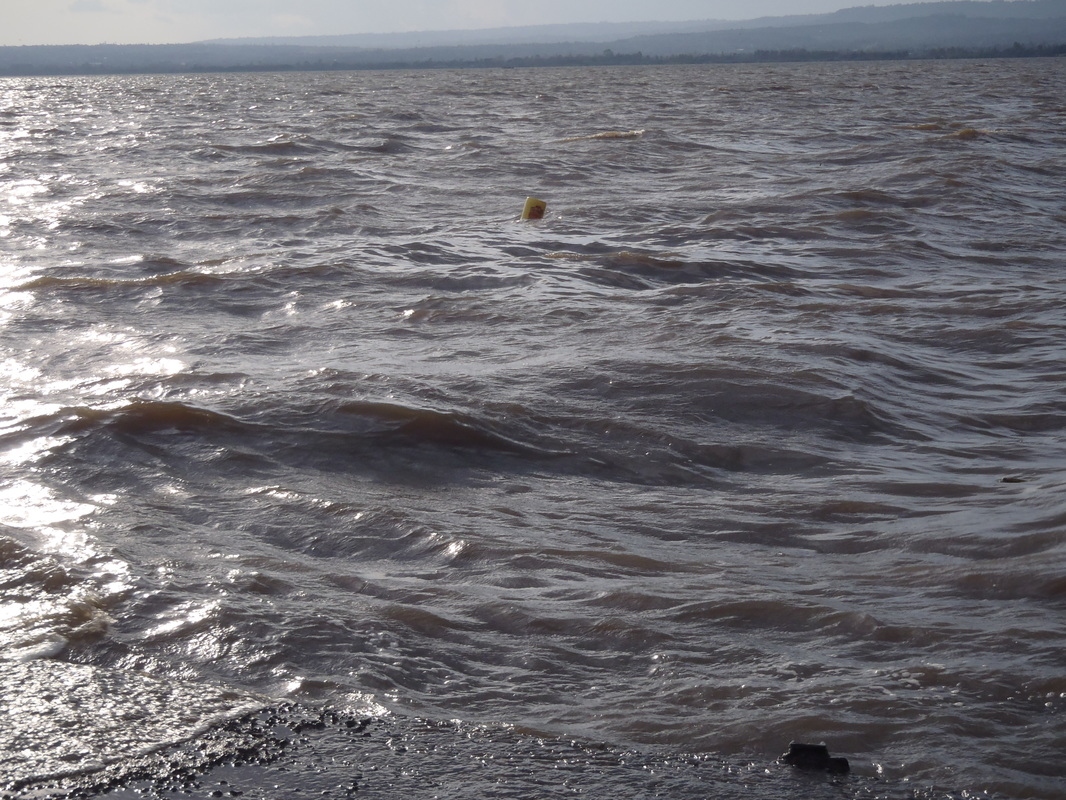
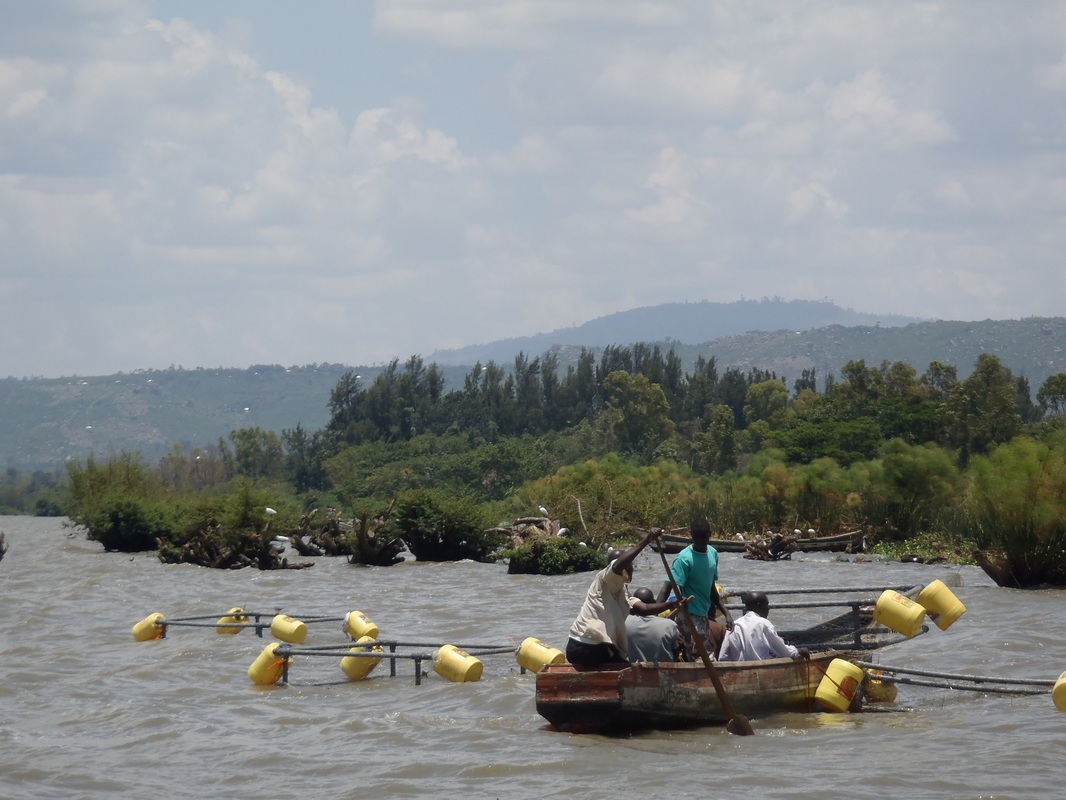
A few months ago, a colleague and I received an award from UW’s Global Health Initiative to investigate how water hyacinth effects water quality in Lake Victoria and how communities around Lake Victoria interact with the lake. I am pretty excited to be starting the project, not just because it gives us the chance to uniquely answer questions at the intersection of ecology and human health, but also because it means a return to East Africa. As an undergraduate, I was lucky enough to be involved with the Nyanza Project on Lake Tanganyika, Tanzania. The undergraduate research experience instilled in me a curiosity about tropical lake limnology, one that I continues with this project. Amber and I are in the middle of our first expedition to Lake Victoria. We are being hosted by Dr. Christopher Aura and the very accommodating staff at the Kenyan Marine Fisheries Research Institute in Kisumu, Kenya. It’s been a busy week thus far: we have partnered with one of the beach communities nearby to host our in situ water hyacinth experiment, we have deployed said experiment, and we have met with lots of researchers and students both within KMFRI and the Kenyan Medical Research Institute (KMRI). Photos (L to R): (1, 2) Zachary Ogari led the transport and deployment of (3) our first experimental enclosure (Usoma Beach, Lake Victoria). Unfortunately, some leaks and the waves of Lake Victoria meant that it did not stay afloat for long. Photos (L to R): (1) A single, floating jug was the only part of our initial cage that stayed afloat in the first 24 hours. (2) However, after some modifications (mainly, preventing leaks!), we successfully launched all four enclosures and (3) added the water hyacinth.
|
Archives
July 2018
Categories |


 RSS Feed
